Bay Area Real Estate: 2025 By the Numbers
Happy New Year! Let’s go through some of the market stats for the Marin and San Francisco real estate markets. There are some interesting insights and differences between the two markets. This letter is going to cover:
- End of year interest rate data
- 2025 Marin and San Francisco County market breakdowns
- Analysis of each market broken down into price segments
- The tea leaves of the market
End of 2025 Macro Data
|
+/- % |
2025 |
2024 |
|
|
30 Year Mortgage Average |
-10.2% |
6.15% |
6.85% |
|
10 Year Treasury Bond Yield |
-8.7% |
4.18% |
4.58% |
|
Mortgage Spread |
-13.2% |
1.97% |
2.27% |
|
10 Year TIPS |
-13.8% |
1.93% |
2.24% |
|
TIPS Spread |
-3.8% |
2.25% |
2.34% |
|
Mortgage Applications Index |
54.8% |
271 |
175 |
|
MOVE Index |
-35.2% |
64.0 |
98.8 |
Notes
The interest rate market ended in 2025 more favorably for borrowers with the 30 Year Mortgage closing out the year at 6.15%, the lowest print of the year. The yield on the 10 Year Treasury Bond settled 2025 -8.7% lower at 4.18%, the Mortgage Spread (difference between the 30 Year Mortgage and the 10 Year Treasury) decreased by -13.2%, and the 10-Year Breakeven Inflation Rate (10 Year Treasury Bond minus the 10 Year Treasury Inflation-Protected Securities (TIPS)) decreased -3.8%. This is all great news for potential homebuyers. In addition, the index measuring mortgage applications increased by a whopping 54.8%. In case you are not familiar, the Move Index has absolutely nothing to do with moving. It is a measure of volatility in the US Treasury market, used to gauge market expectations of volatility over the next 30 days published by BofAML. It ended the year -35% lower than the end of 2024.
Concisely, there were lower interest rates, lower interest rate volatility, lower borrowing costs, and more mortgage applications at the end of 2025 compared to the end of 2024. All good things for consumers and the real estate market for 2026.
Marin County Highlights
The market in general grew compared to 2024 sales and transactions. Although the fourth quarter showed an increase in transactions, each month showed lower sales than last year. HUGE contrast to San Francisco. Everyone I worked with said it was a weird environment where negotiations between buyers and sellers were often challenging. What is interesting is that the condo market in Marin totally sucked this year, despite the single-family home market growth in transactions and dollar sales, and the Condo market in SF exploded.
|
Marin County Total Sales 2025 vs 2024 |
|||||||
|
$ Sales |
Transaction Count |
||||||
|
+/- % |
2025 |
2024 |
|
+/- % |
2025 |
2024 |
|
|
Oct |
-4.3% |
$ 467,234,699 |
$ 488,410,670 |
Oct |
1.2% |
252 |
249 |
|
Nov |
-2.5% |
$ 327,926,652 |
$ 336,288,294 |
Nov |
9.3% |
199 |
182 |
|
Dec |
-2.5% |
$ 327,926,652 |
$ 336,288,294 |
Dec |
9.3% |
199 |
182 |
|
YTD |
6.8% |
$ 4,519,459,898 |
$ 4,233,585,015 |
YTD |
5.2% |
2221 |
2112 |
|
|
|
|
|
|
|
|
|
|
Marin County Single Family Home Sales (Ex Condo) 2025 vs 2024 |
|||||||
|
|
$ Sales |
Transaction Count |
|||||
|
+/- % |
2025 |
2024 |
|
+/- % |
2025 |
2024 |
|
|
Oct |
-6.2% |
$ 434,066,474 |
$ 462,698,195 |
Oct |
-2.8% |
211 |
217 |
|
Nov |
-1.2% |
$ 308,155,652 |
$ 311,768,447 |
Nov |
14% |
174 |
153 |
|
Dec |
-3.2% |
$ 249,353,106 |
$ 257,701,650 |
Dec |
-3.5% |
136 |
141 |
|
YTD |
7.9% |
$ 4,233,132,519 |
$ 3,924,059,634 |
YTD |
6.4% |
2035 |
1913 |
|
|
|
|
|
|
|
|
|
|
Marin County Condo Sales 2025 vs 2024 |
|||||||
|
$ Sales |
Transaction Count |
||||||
|
+/- % |
2025 |
2024 |
|
+/- % |
2025 |
2024 |
|
|
Oct |
29% |
$ 33,168,225 |
$ 25,712,475 |
Oct |
28% |
41 |
32 |
|
Nov |
-9.6% |
$ 22,163,000 |
$ 24,519,847 |
Nov |
0.0% |
29 |
29 |
|
Dec |
-51% |
$ 13,606,347 |
$ 27,610,000 |
Dec |
-19% |
25 |
31 |
|
YTD |
-7.5% |
$ 286,327,379 |
$ 309,525,381 |
YTD |
-5.4% |
351 |
371 |
2025 In Marin:
-
Total Marin market grew 6.8% in dollar sales and 5.2% in total transactions
-
Single family homes grew 7.9% in dollar sales and 6.4% in total transactions
-
Condo market dollar sales decreased by -7.5% and 5.4% in total transactions
-
In Q4 dollar sales decreased but transactions increased compared to Q4 2024, compressing the median price of homes sold
|
San Francisco Residential Sales 2025 vs 2024 |
|||||||
|
$ Sales |
Transaction Count |
||||||
|
+/- % |
2025 |
2024 |
|
+/-% |
2025 |
2024 |
|
|
Oct |
24% |
$ 1,096,471,983 |
$ 886,642,313 |
Oct |
26% |
585 |
466 |
|
Nov |
10% |
$ 787,376,092 |
$ 715,715,797 |
Nov |
-0.9% |
425 |
429 |
|
Dec |
39% |
$ 647,929,080 |
$ 466,308,176 |
Dec |
19% |
366 |
308 |
|
YTD |
13% |
$ 8,828,200,955 |
$ 7,829,407,741 |
YTD |
17% |
5007 |
4268 |
|
|
|
|
|
|
|
|
|
|
San Francisco Single Family Sales (Ex-Condos) 2025 vs 2024 |
|||||||
|
$ Sales |
Transaction Count |
||||||
|
+/- % |
2025 |
2024 |
|
+/-% |
2025 |
2024 |
|
|
Oct |
20% |
$ 699,854,812 |
$ 581,669,789 |
Oct |
10% |
284 |
258 |
|
Nov |
9.8% |
$ 481,410,309 |
$ 438,633,320 |
Nov |
-7.8% |
200 |
217 |
|
Dec |
56% |
$ 402,140,417 |
$ 257,947,753 |
Dec |
18% |
174 |
147 |
|
YTD |
12% |
$ 5,444,942,241 |
$ 4,881,977,977 |
YTD |
13% |
2427 |
2153 |
|
|
|
|
|
|
|
|
|
|
San Francisco Condo Sales 2025 vs 2024 |
|||||||
|
$ Sales |
Transaction Count |
||||||
|
+/- % |
2025 |
2024 |
|
+/-% |
2025 |
2024 |
|
|
Oct |
30% |
$ 396,617,171 |
$ 304,972,524 |
Oct |
45% |
301 |
208 |
|
Nov |
10% |
$ 305,965,783 |
$ 277,082,477 |
Nov |
6.1% |
225 |
212 |
|
Dec |
18% |
$ 245,788,663 |
$ 208,360,423 |
Dec |
19% |
192 |
161 |
|
YTD |
15% |
$ 3,383,258,714 |
$ 2,947,429,764 |
YTD |
22% |
2580 |
2115 |
2025 In San Francisco:
- Dollar sales increased by 13% (2x that of Marin) and transactions increased by 17%
- The Condo market outperformed the single family home market in 2025 in dollar sales and transactions (Condos represent 38% of the SF market in 2025)
- December dollar sales were 39% greater than December 2024
- The absorption rate for December (homes for sale divided by pending sales) was 62%, the highest reading going back to 2011! Inventory was low, but the buyers were active.
Marin San Francisco Comparisons
|
Median Sold Price: |
+/- % |
2025 |
2024 |
|
3 bed 2 bath Single Family Home in Marin $892 per sq ft |
-6.8% |
$ 1,398 |
$ 1,500 |
|
3 bed 2 bath Single Family Home in SF $1041 per sq ft |
3.4% |
$ 1,675 |
$ 1,620 |
|
2 bed 1 bath Condo in Marin $587 per sq ft |
6.9% |
$ 510 |
$ 477 |
|
2 bed 1 bath Condo in SF $1035 per sq ft |
4.5% |
$ 1,150 |
$ 1,100 |
- 3 bed 2 bath homes in Marin underperformed equivalent homes in SF in 2025
- 2 bed 1 bath condos sold for almost twice the $ per square foot in SF compared to Marin
- In terms of absolute dollars, Marin County condos represent a better value compared to San Francisco. (Keep in mind the California Balcony Law)
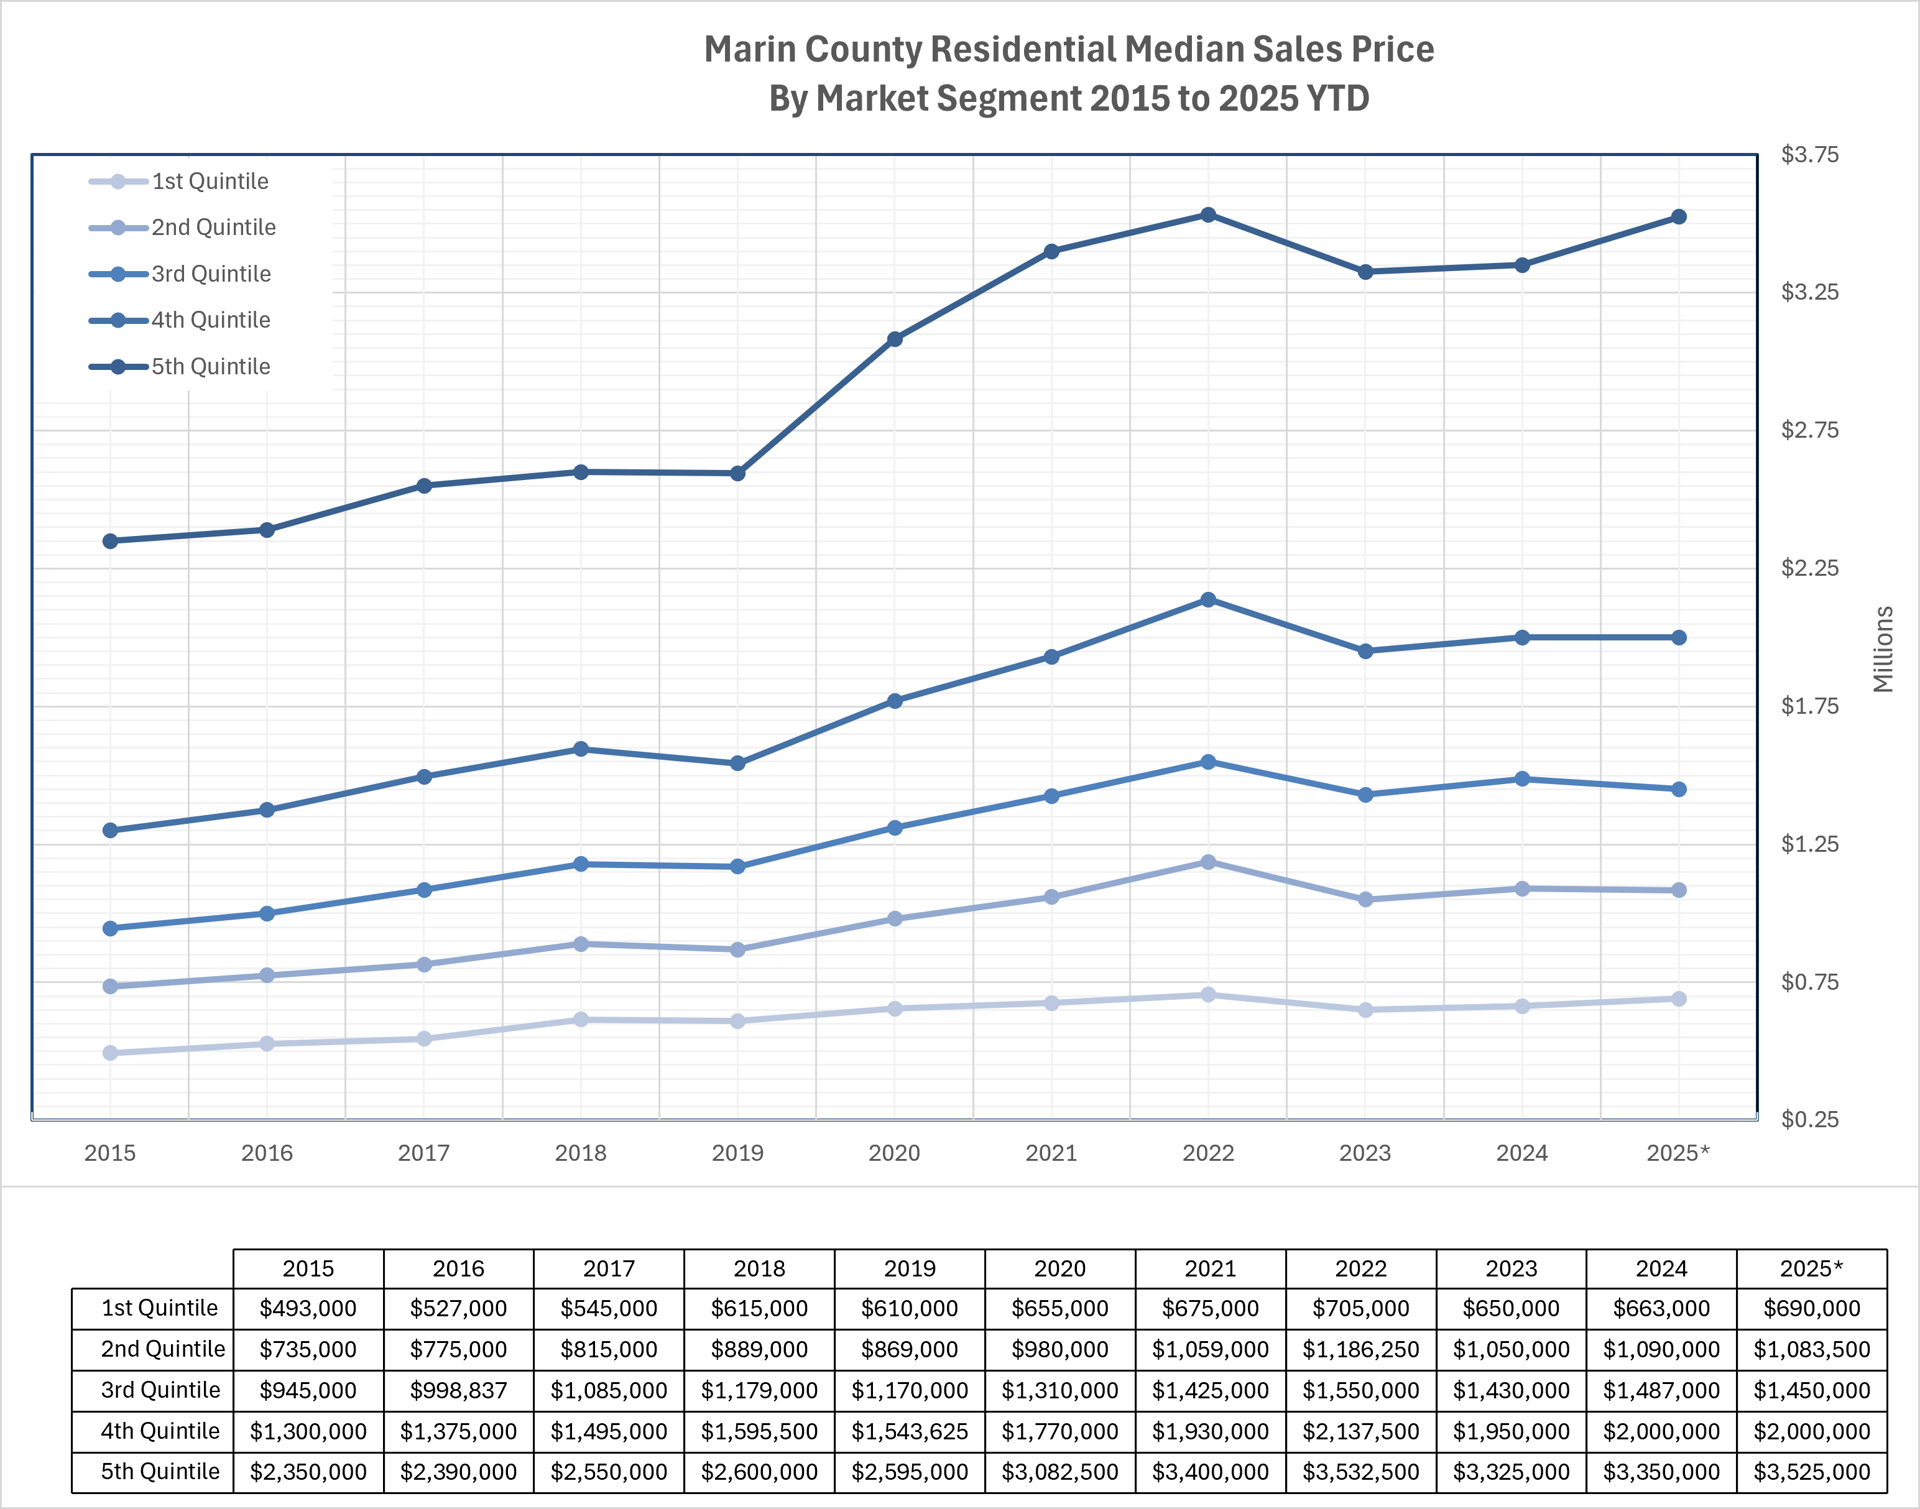
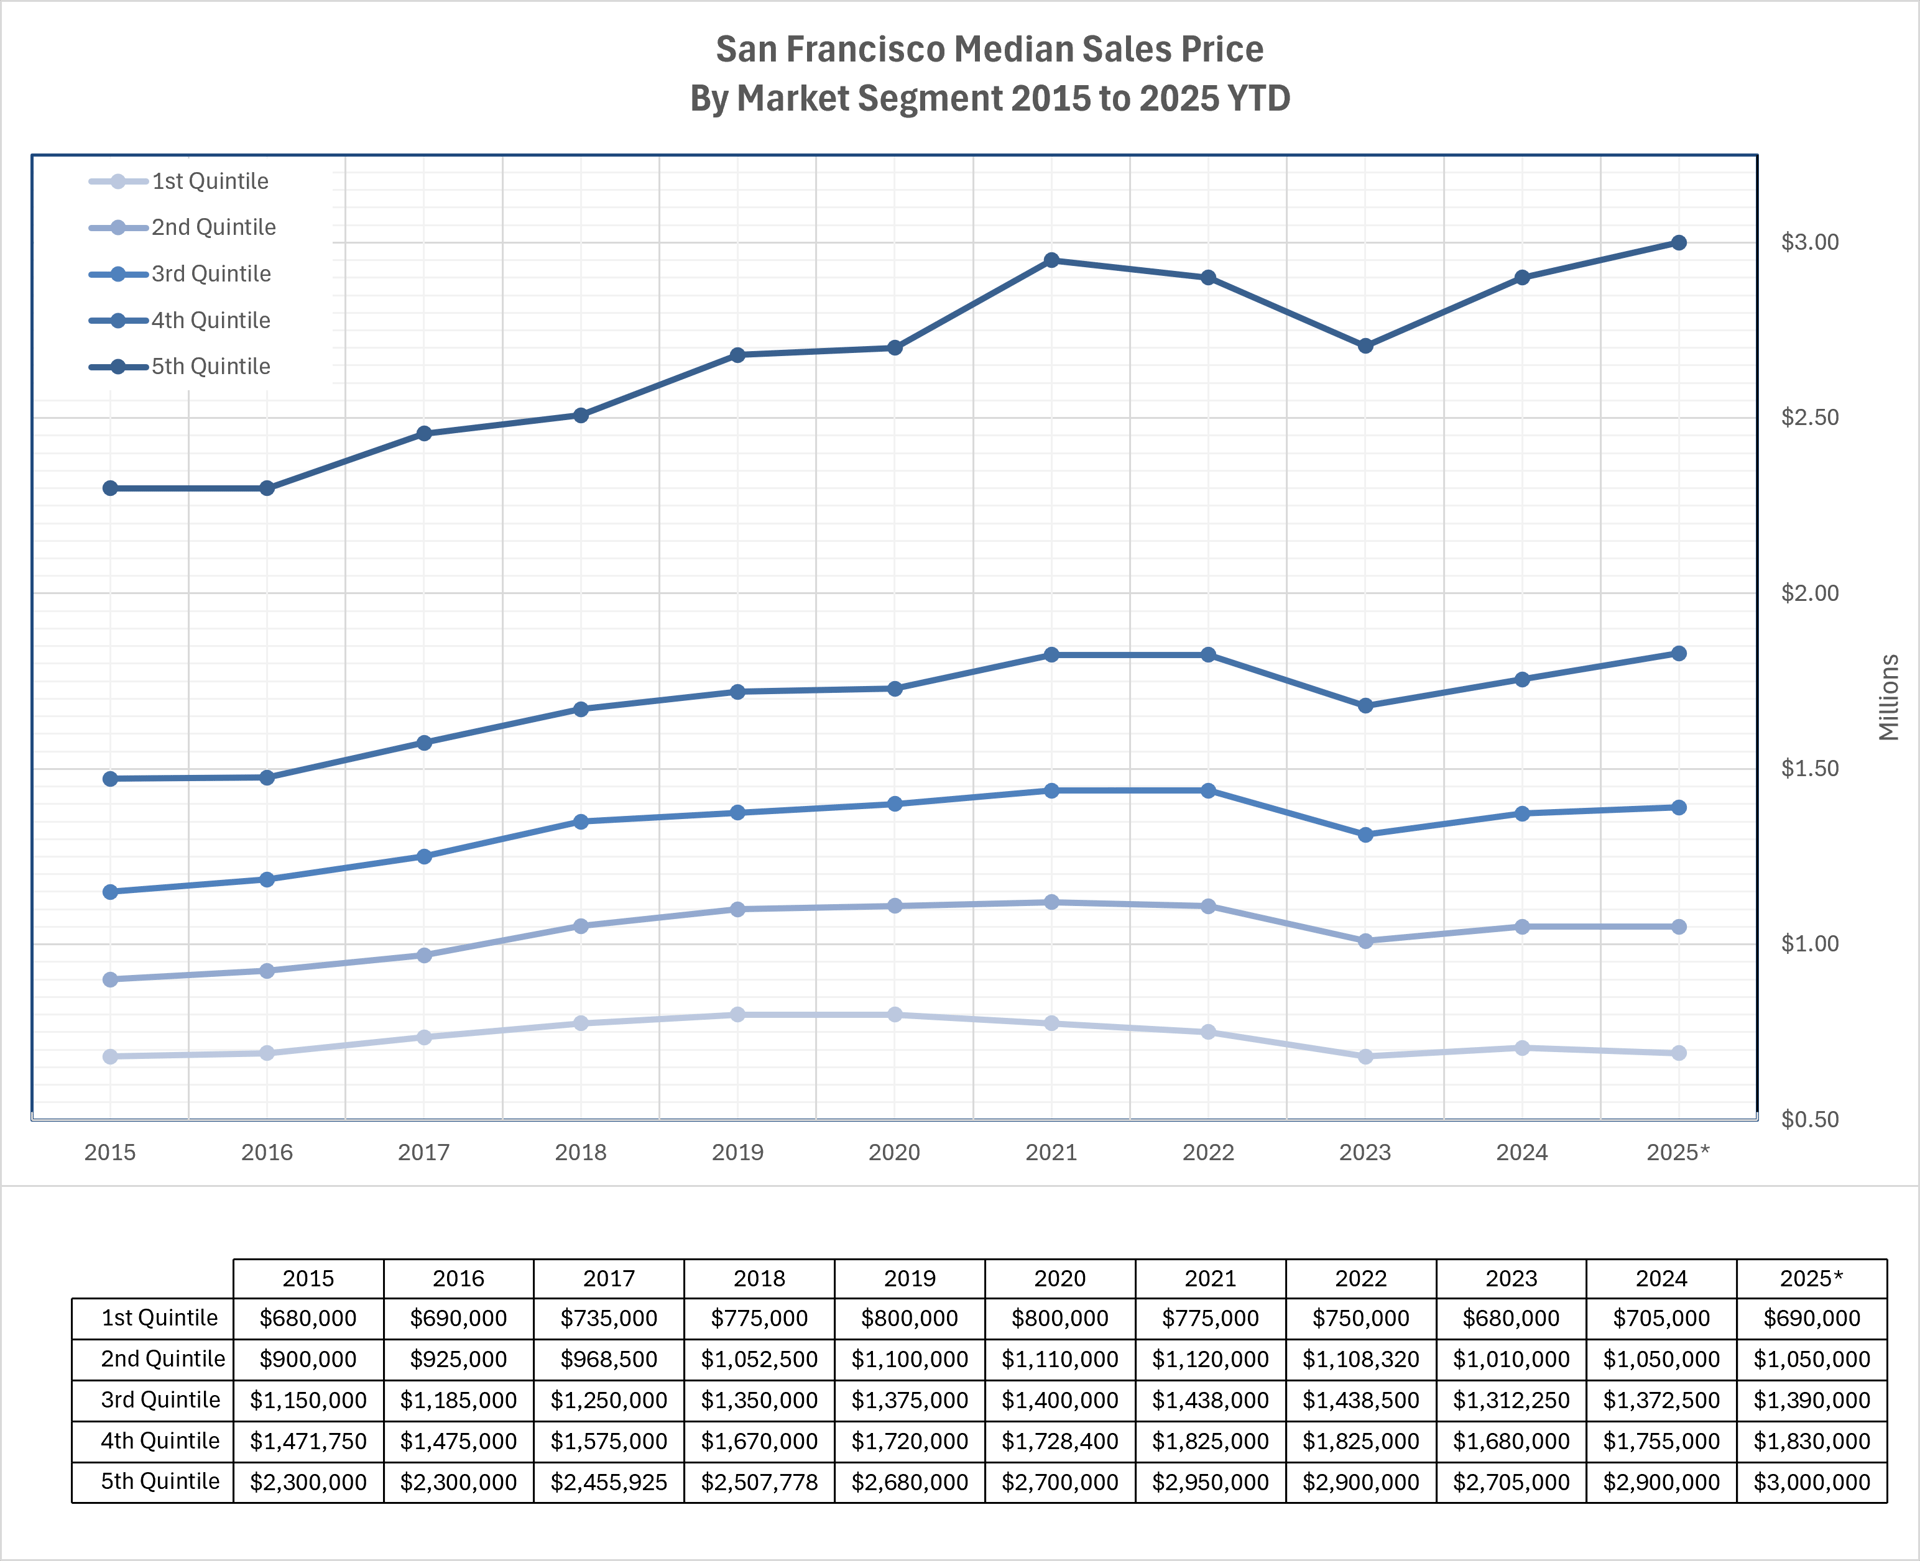
Market Segments
To better understand the respective markets by price point, I broke up the sales data into five quintiles. Each segment (quintile) represents 20% of the market. In both Marin and SF markets, you see that the top 20% of the market is nearly at or has surpassed peak prices seen during the flurry of activity during the pandemic. In this top quintile, the median price is $3,525,000 in Marin and $3,000,000 in SF. As mentioned above, the SF market, especially the top 40%, is outperforming Marin County. The bottom three quintiles in both markets underperform the top two. The interest rate sensitive consumer is being more cautious with their pocketbook. Homes under $1,500,000 could be an excellent value compared to higher segments in both markets.
The Tea Leaves
I do not dare make any predictions about the market, but I will provide some more data that will affect the market. I am editing this on 1/11/26, and the most recent 30 Year Mortgage average recorded by my friend FRED (Federal Reserve Bank of St. Louis) was 6.16% on 1/8/26. As I mentioned at the beginning, mortgage applications are 55% higher than last year, and current market volatility is lower in both the bond and equity markets. All favorable for potential borrowers. Here’s an interesting statistic: from 2019 to 2024, median household income in California increased by 29%, from $78,100 to $100,600. (Source is FRED again) For the same period, the median price for the middle quintile (middle market segment) increased by 23%. Median wages have increased at a faster rate than home prices from 2019 to 2024. Based on the real estate market in San Francisco in 2025, I am guessing median wages continued their rise. If interest rates stay around 6% and the volatility in the interest rate markets remains low, this could open the door for a lot of buyers that have been sitting on the sidelines.
This is totally a qualitative statement, but a lot of veteran agents that I work with are viewing 2026 optimistically. I have been working with buyers eager to see new inventory. Inventory levels in Marin and SF are still historically low, but the buying activity has picked up. Beautifully finished properties in good condition that were priced competitively received multiple offers and sold quickly. Could the buyers feeling priced out of San Francisco and San Mateo counties start shopping and buying in Marin? Again, I am not trying to talk up my book. Confirmation bias is dangerous. I will say that the data does look positive for the Bay Area real estate market in 2026. If you are looking to buy, it would be a good idea to start planning now so you are prepared to jump when you see the home you want. I am available to talk, advise, or just be a sounding board for your thoughts. Either way, call me anytime.
In my next letter I will provide more information about the dynamics of the market by examining the relationship of active, pending and sold properties, and discuss why the Fed’s actions on short term interest rates should not affect the decision to buy or sell real estate.
Gratefully,
Gene J Koziarz
352 Miller Avenue
Mill Valley, CA 94941